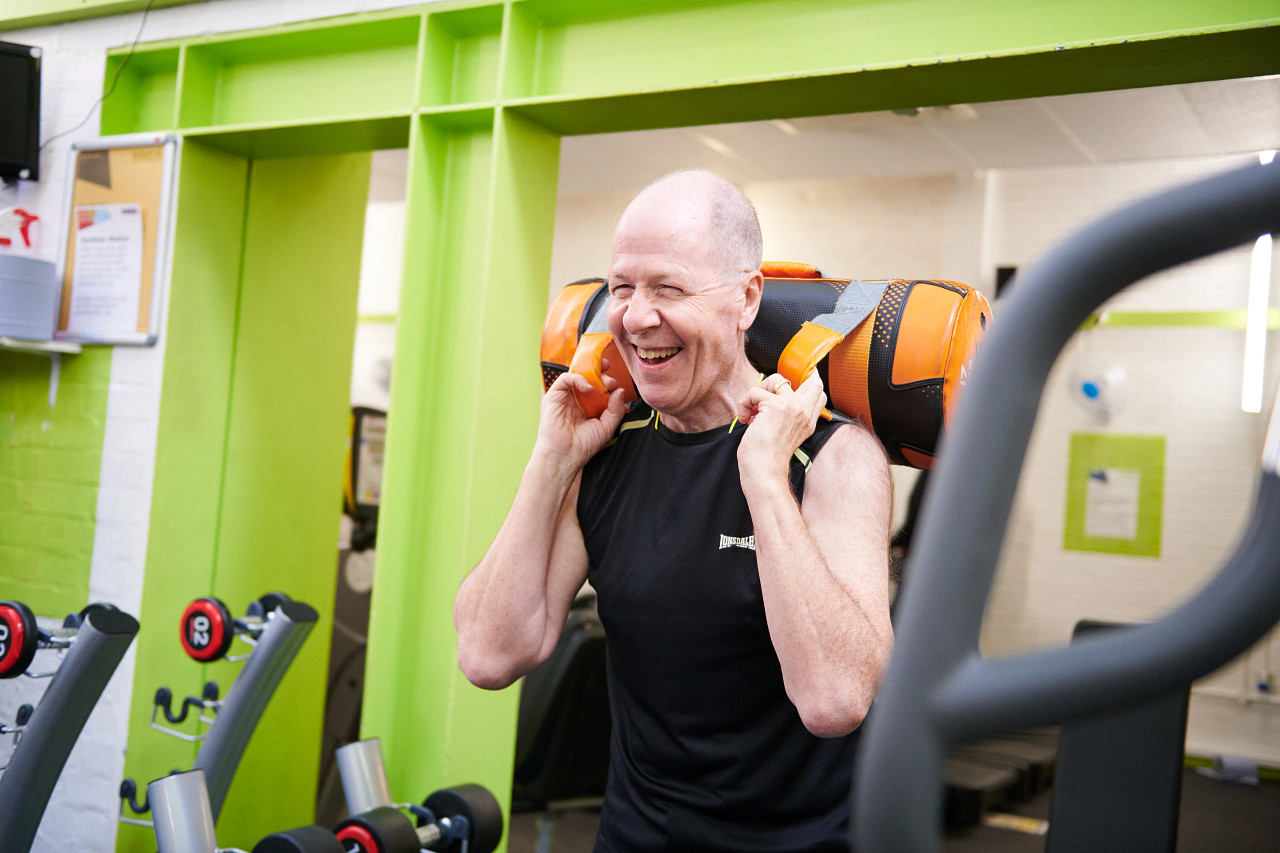
Champions For Change
An innovative project designed to empower individuals to make positive changes in their lives. Participants work closely with our trained staff over a number of weeks with support in physical activity and nutrition to improve their mental & physical health promoting overall wellbeing.
Personalised Approach
The project is adaptable, with various elements that can be customised depending on the individual's needs and goals.
Health & Wellbeing
Activities are designed to improve both physical and mental health, promoting overall wellbeing.
Community Engagement
Participants become active members of the gym community, fostering positive change in and beyond the programme.
Skill Development
Opportunities to learn new skills and build confidence in various areas of life.
The Participant Journey
Initial Assessment
Each participant undergoes an assessment to determine their specific needs and goals.
Tailored Activities
A personalised mix of physical exercise sessions, mindfulness workshops, and nutrition education.
Regular Check-ins
Ongoing support and progress reviews throughout the programme to ensure goals are being met.
Through Champions for Change, YMCA Manchester aims to create lasting positive impact, helping individuals improve their own lives through mind, body, and spirit.
Participant Locations
This map shows where participants come from, plotted by their postcode sector. Hover over a marker to see the IMD (Index of Multiple Deprivation) decile for that area. Lower deciles indicate more deprived areas.
Gender Distribution
The gender breakdown of participants on the programme. This helps ensure we are reaching a diverse audience.
Deprivation Index (IMD)
Shows how many participants come from each IMD decile. Decile 1 = most deprived, Decile 10 = least deprived. We aim to reach those in the most deprived communities.
Age Distribution
The age range of participants, grouped into bands. This helps us understand which age groups we are engaging most effectively.
Ethnicity Distribution
A breakdown of participants by ethnicity, helping us monitor the diversity and inclusivity of the programme.
Disability Status
Shows how many participants have declared a disability. This supports our commitment to accessible and inclusive programming.
Programme Completion Funnel
Shows how participants progress through the programme — from initial registration through to full completion. This helps identify where participants may need additional support.
SWEMWBS Wellbeing Scores
The Short Warwick-Edinburgh Mental Wellbeing Scale measures mental wellbeing on a scale of 7–35. Higher scores mean better wellbeing. We measure at three timepoints: start (T1), mid-programme (T2), and end (T3).
SWEMWBS Scores by Domain
Breaks down wellbeing into 7 domains (optimism, usefulness, relaxation, etc.) to show where the biggest improvements are happening across timepoints.
Wellbeing Category
Participants are categorised as having Low, Normal, or High wellbeing at each timepoint. This shows how many people move from lower to higher categories over time.
Self-Perceived Health (EQ-VAS)
Participants rate their overall health from 0 (worst imaginable) to 100 (best imaginable). An increasing score indicates participants feel healthier over the programme.
Activity Level (Active Lives Survey)
Measures how physically active participants are across the programme. Based on the Sport England Active Lives framework. Higher scores mean more activity.
Socialisation Frequency
From the Community Life Survey — measures how often participants interact socially with friends, family, and neighbours. Higher scores indicate more frequent socialisation.
Quality of Support
Also from the Community Life Survey — measures how connected and supported participants feel. Scored out of 8, with higher scores indicating better perceived quality of social support.
How We Measure Change
Our measurement framework uses validated scales to understand not only who we are working with, but what the outcomes and impact of that work look like over time.
SWEMWBS
Short Warwick-Edinburgh Mental Wellbeing Scale
A validated 7-item questionnaire measuring mental wellbeing using a 5-point Likert scale. Assesses positive thoughts and feelings over the past two weeks. Scores range from 7 to 35, with higher scores indicating better mental wellbeing.
EQ-VAS
EQ Visual Analogue Scale
A self-report measure of health-related quality of life on a scale from 0 to 100. Participants mark their current health status, where 0 represents the worst health imaginable and 100 represents the best. Part of the EQ-5D instrument.
Active Lives Survey
Sport England Physical Activity Measure
Measures physical activity levels across various forms of activity including sport, fitness, walking, and cycling. Provides insights into participation barriers, motivations, and the impact of activity on wellbeing.
Community Life Survey
Social Cohesion & Engagement Measure
Explores social cohesion and community engagement. The socialisation section measures frequency and nature of social interactions, feelings of connection, and participation in community activities. Addresses social inclusion and loneliness.
Statistical Testing Approach
We use a paired t-test methodology (test-retest with the same sample), looking for an effect size of 0.8, set at 80% power. Based on sample size calculations, this requires a minimum sample of 14 at 80% power and 54 at 90% power.